
|
Data Mining with GSPC tools
|
|
|
|
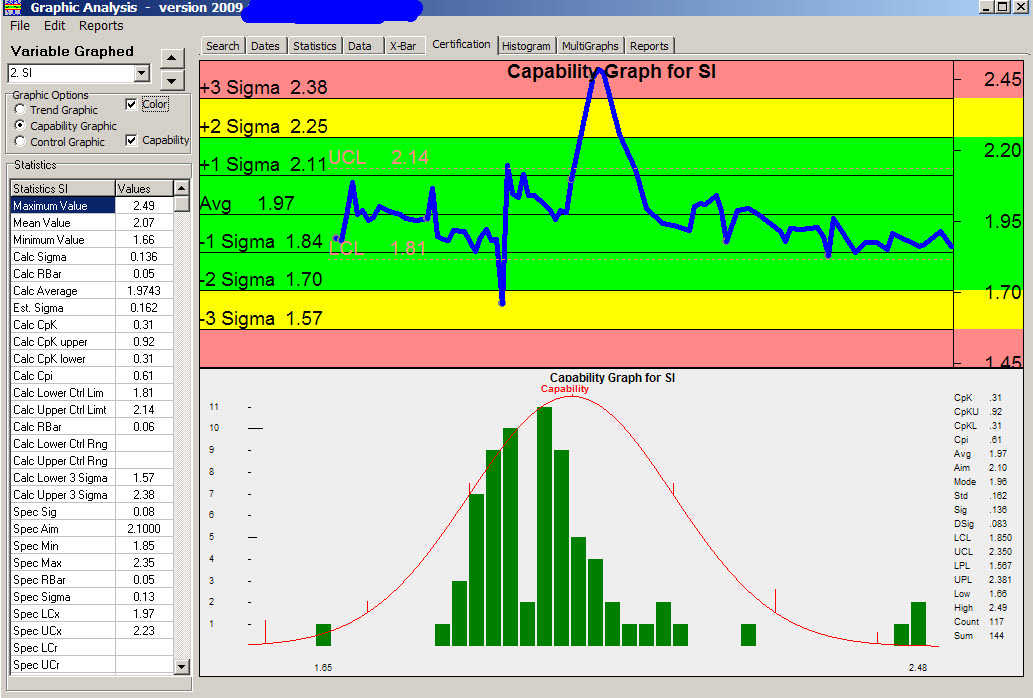
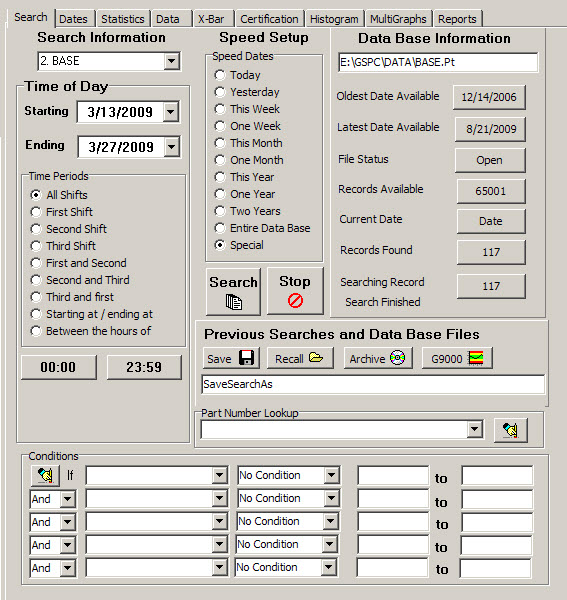
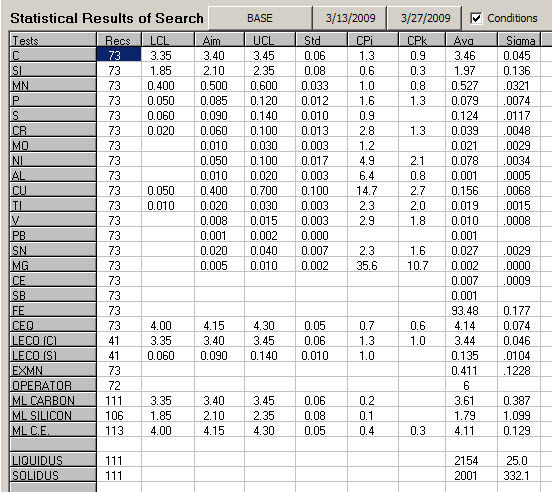
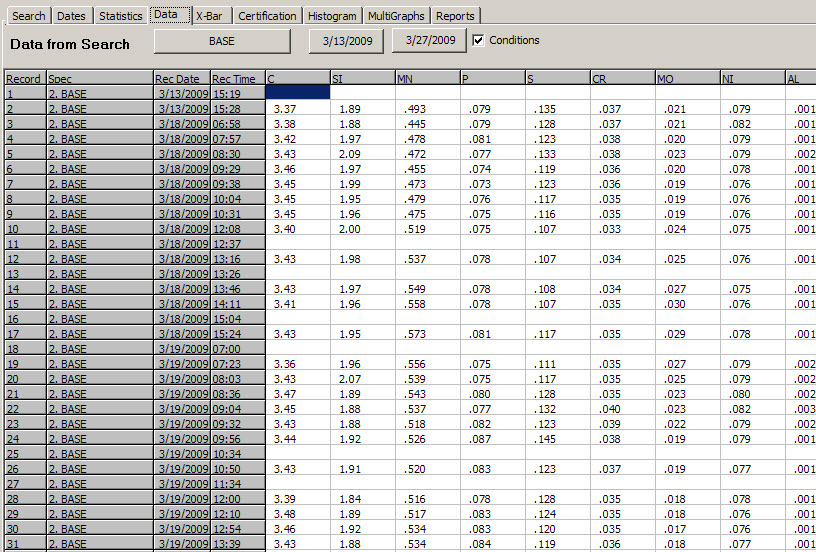
This program offers the supervisor instant access to the historical records on any process stored in the GSPC system. The
search starts out by picking a process, selecting the date range, (optionally the time/shift range) and setting any conditions
required. Depending on the speed of your server, the search function pulls 100 to 300 records per second to qualify them. Only records
in the date range you specified are looked at, so generally in less than a minute, you can have the results of thousands of data
points on your graph. Once searched, all the process tests (carbon, silicon, etc for a melting process) can be instantly graphed: no
further searching required.
All statistics, data and graphs copy and paste easily to Microsoft's Word and Excel programs. Click any picture to enlarge.
|
|
-
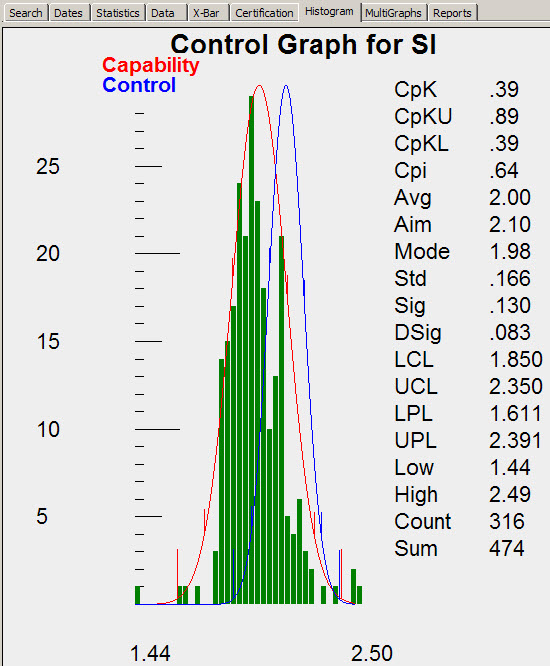
Capability and histogram
-
Graphic search tool
-
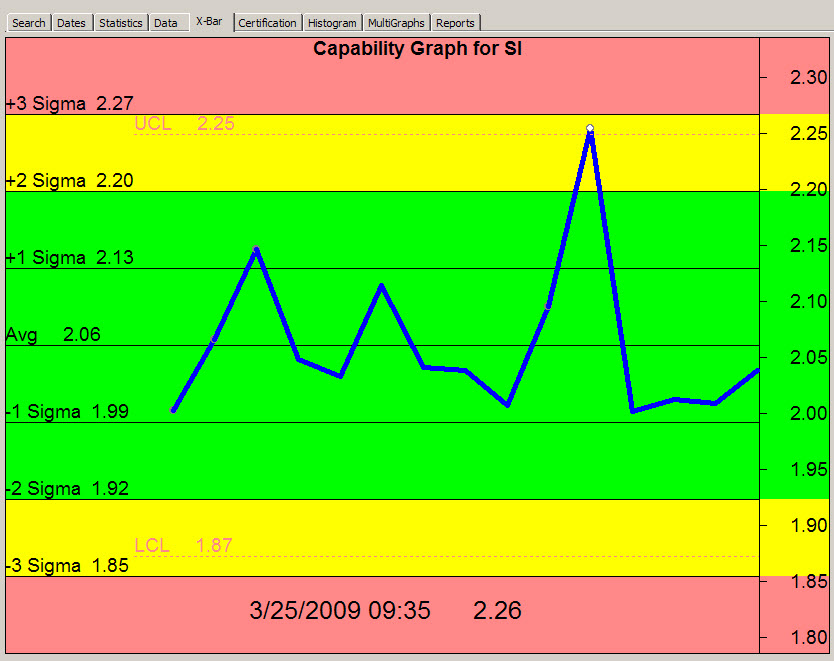
Trend, capability or control
|
-
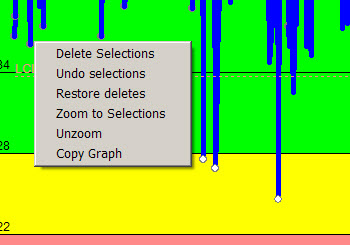
Right click options
-
Histogram display
-
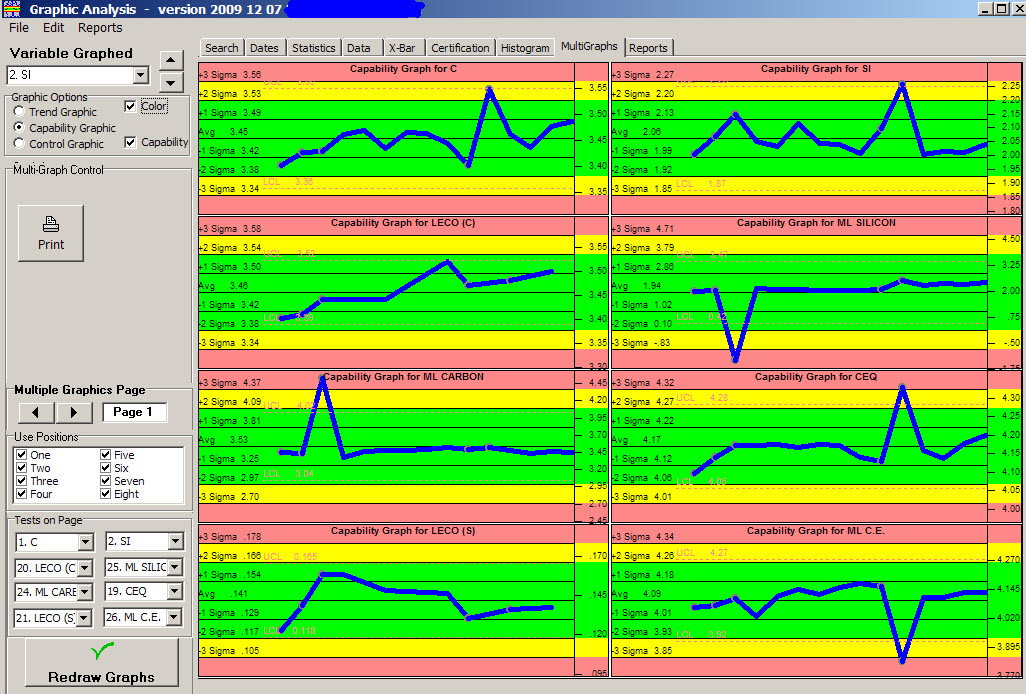
Multiple graphs display
|
-
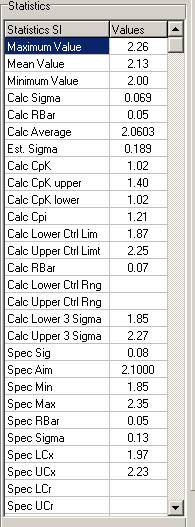
Statistics available
-
More statistics
-
Cut and paste 10,000 tests
|
|
|
|
|
|
|
Copyright © MeltLab Systems Winchester, VA, USA 2014
|
|
|
|
|