
Using Micro Thermal Analysis, we determine what the microstructure of the metal is, the percent of the different components, the fraction solid of the metal at different temperatures and how inoculation and treatments of the iron will affect the final product. Common Defects such as gas and shrinkage are measured and reported for quality control. It is a useful tool to standardize both the metal and the nucleation potential of that metal to make a more consistent casting.
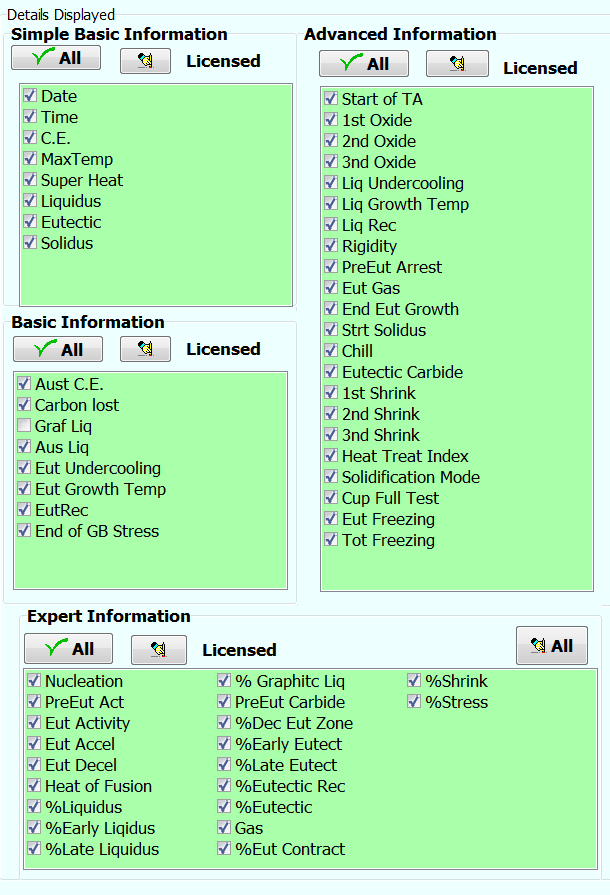
MeltLab for Gray Iron has four levels of operation for different information and available tests, depending on your foundry’s needs.
Click on the level below to view the options available for testing:
The concept of zones of Solidification for Gray Iron
We know different constituents percolate out at different stages in the solidification process. The energy generation of a phase offsets the cooling of the material and shows up on the cooling curve as discrete zones. There are also small temperature changes that can signal things like carbide formation or shrinkage.
By using physics and metallurgy, these zones can be identified. Using math, these areas can be measured for a better control of our castings. The curve below has 8 major zones of interest. The bumps in the curve in area 2 to the left of the Rigidity point are primary carbides and will be discussed elsewhere.
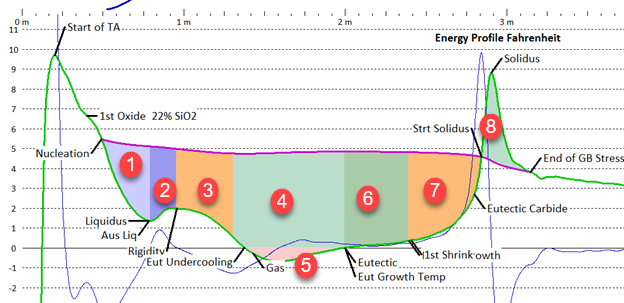
- This is the early liquidus area where dendrites are rapidly growing. This curve is gray iron, and has no problem nucleating dendrites.
- This is the late liquidus area which is dominated by dendritic branching.
- This is the early eutectic and extends down to the maximum rate of acceleration.
- This is where the eutectic formation has gained its max acceleration.This is the main area of eutectic growth and includes area 5.
- This is the area of recalesence. This is where the iron is making more heat energy than is being lost. Larger area indicates weaker nucleation.
- This is the mid-to-late eutectic area is where the eutectic energy generation slows down and an equilibrium growth rate dominates. Graphite/austenite production continues, feeding is still good, and little shrink is evident.
- This area is the last Eutectic. Feeding is now restricted and both shrink and carbides are often found forming in this area.
- This is the grain boundary stress area where more is better. Stresses which do not result in shrink or micro-porosity go into grain boundary stress. The late graphite growth between solidus and eutectoid will tighten up the loose grain boundaries and remove this stress. It is better to have this area then to have shrinkage or micro-porosity. The more of this area is present, the less you will have of the other.
A small sample of liquid metal is poured into a sand cup with a horizonal thermocouple and allowed to solidify. The temperature of the metal is rapidly sampled during solidification, and the information fed into a real-time computer program. This data is then transformed into a visual interpretation of the various phases and mathematically transformed into the percent of each zone of solidification.
Micro-thermal analysis is a useful tool to characterize and to be able to see changes and differences in the iron quickly and easily. Together with physical testing, it will improve the casting process and help understand our processes and make a better, more consistent product.
View the cooling rates and curves for the following types of Gray Iron:
- Gray Iron Type 40
- Gray Iron Type 50
Click HERE to return to Our Software